
4. House Price Prediction in Mecklenburg County, NC
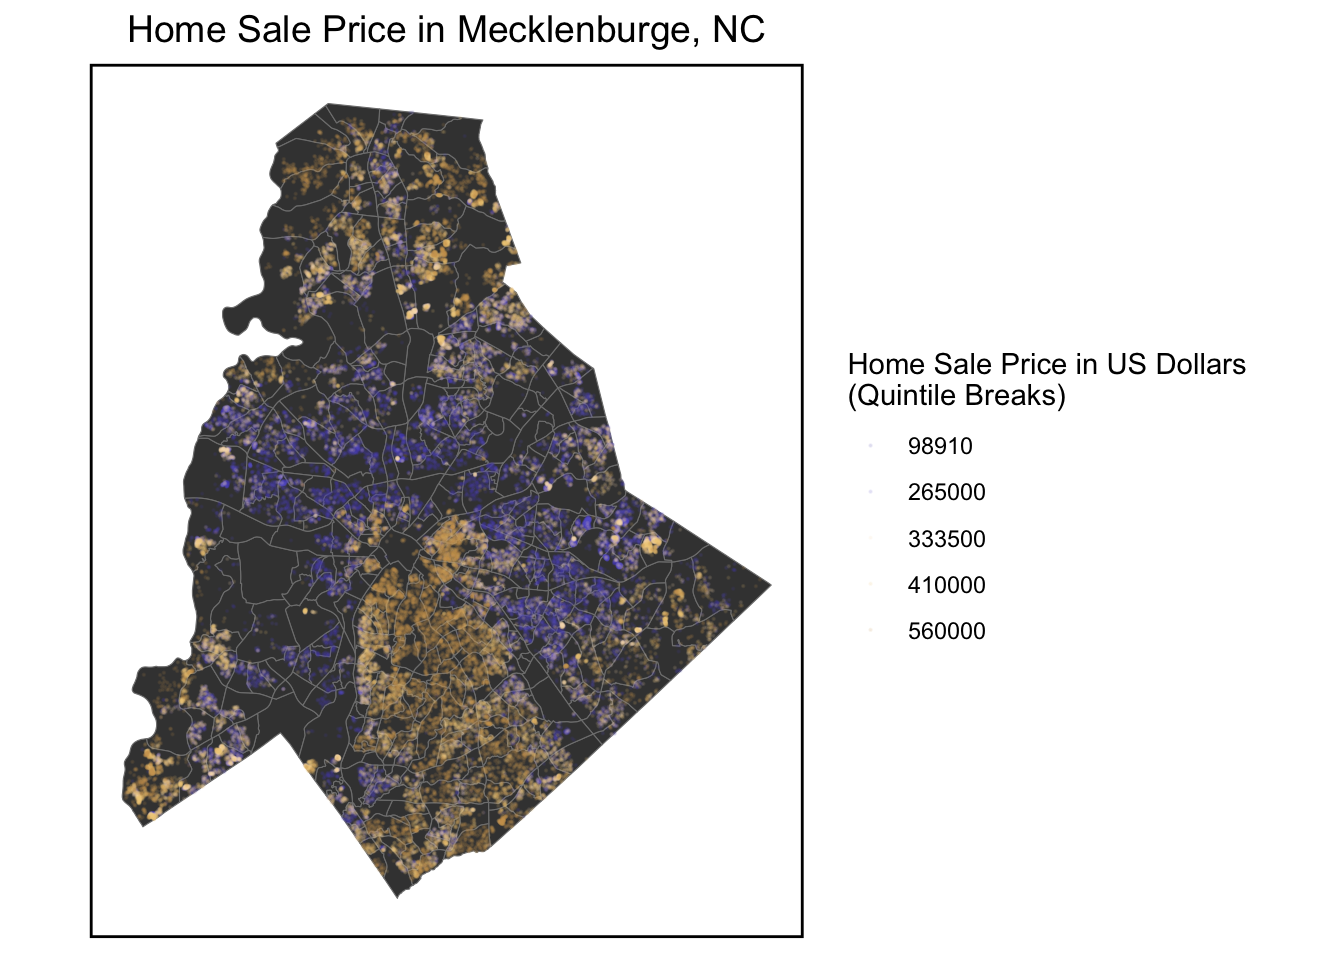
In Mecklenburg County, the housing market shows good trend recent years. Housing Price Prediction is necessary and helpful. The hedonic model is a theoretical framework for predicting home prices by deconstructing house price into the value of its constituent parts.
We first make OLS predictions according to the original dataset, and then filter the predictions according to the performance of the r square and MAPE to continuously optimize our model.
Data Exploratory
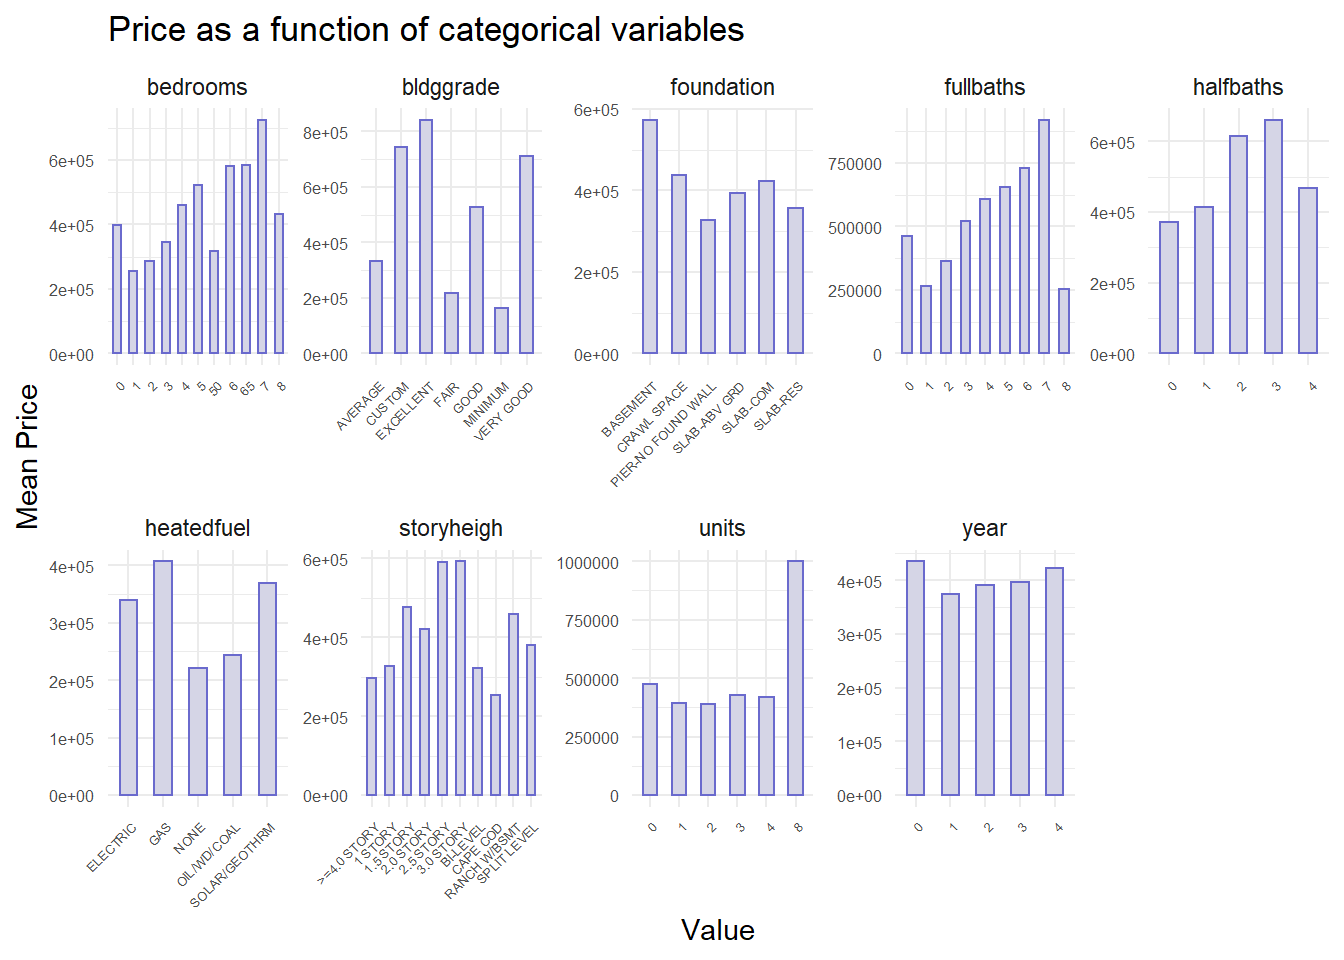
In the model, the dependent variable is house sale price. The factors are contains 3 types:
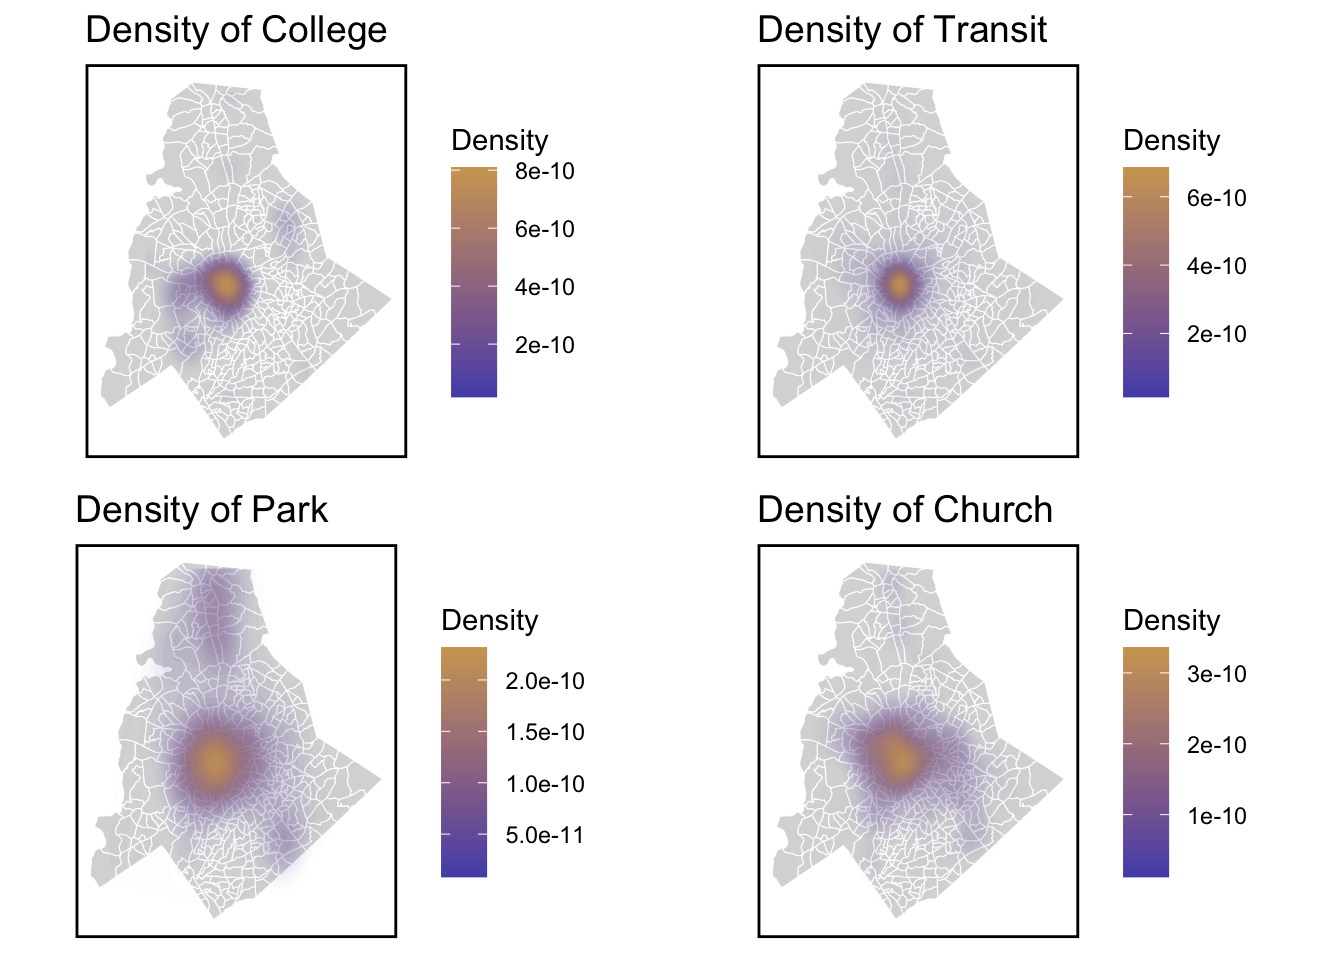
1.Interal characteristics
2.Amenities of decision factor
3.Spatial structure
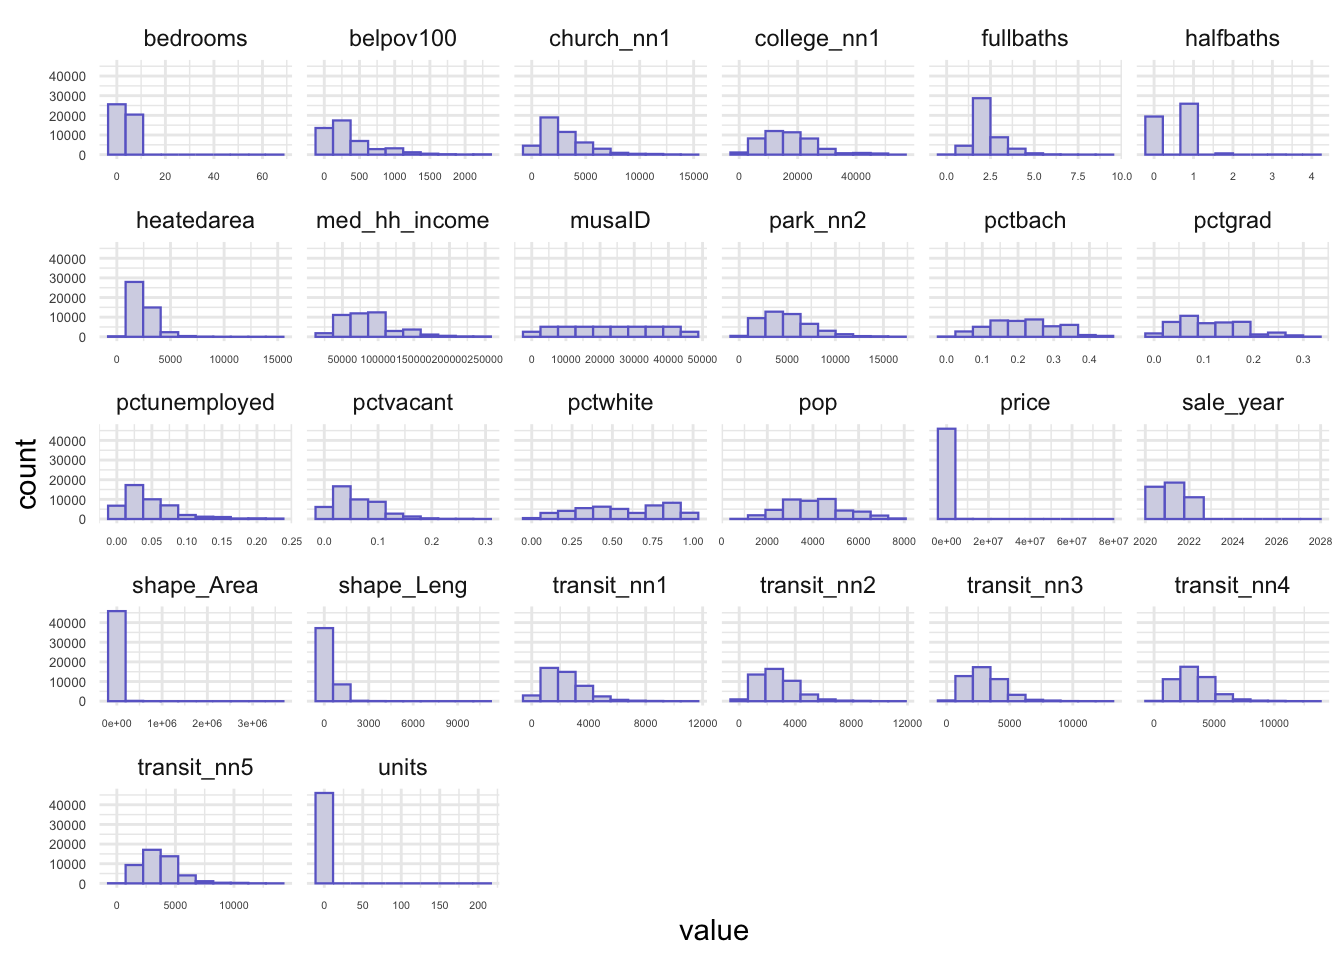
In the histograms of numeric variables, it can be concluded the distribution of the number of the variables. These sample data are relatively concentrated.
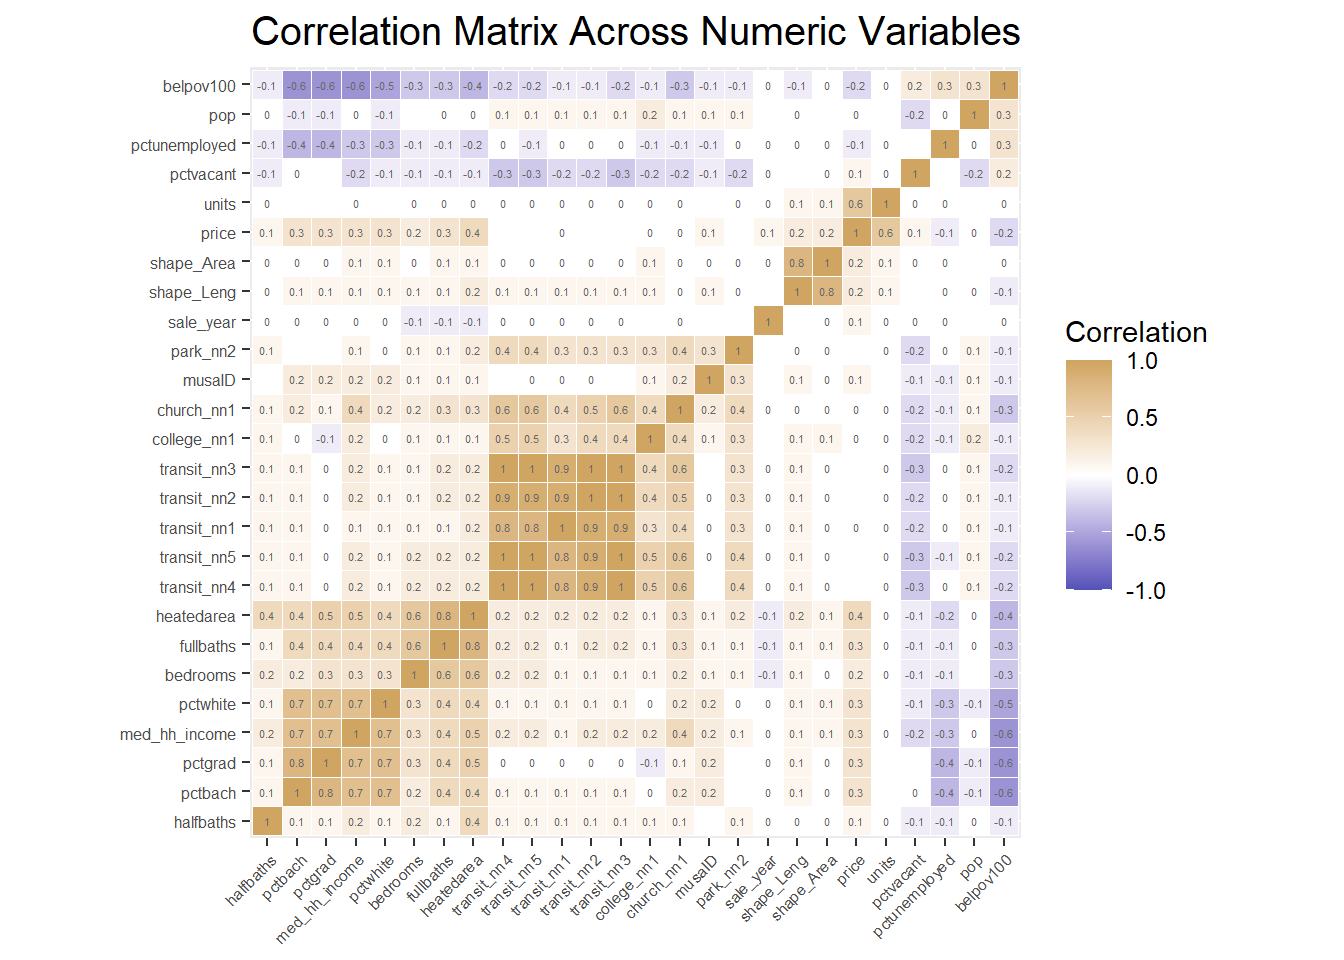
Correlation Matrix
A correlation matrix gives us the pairwise correlation of each set of features in our data. We add the each predictors’R square of correlation matrix in the plot. Our analysis of pairwise correlations between these predictors helps us assess the degree of association between these predictors.
At this time, we are going to delete collinear independent(R srquare>0.75 or <-0.75).
We choose the length of shape, distance to nearest 3 transit stops, percent of graduate, and move the shape area, percent bachelor degree and distance to nearest others transit stops out at the same time.
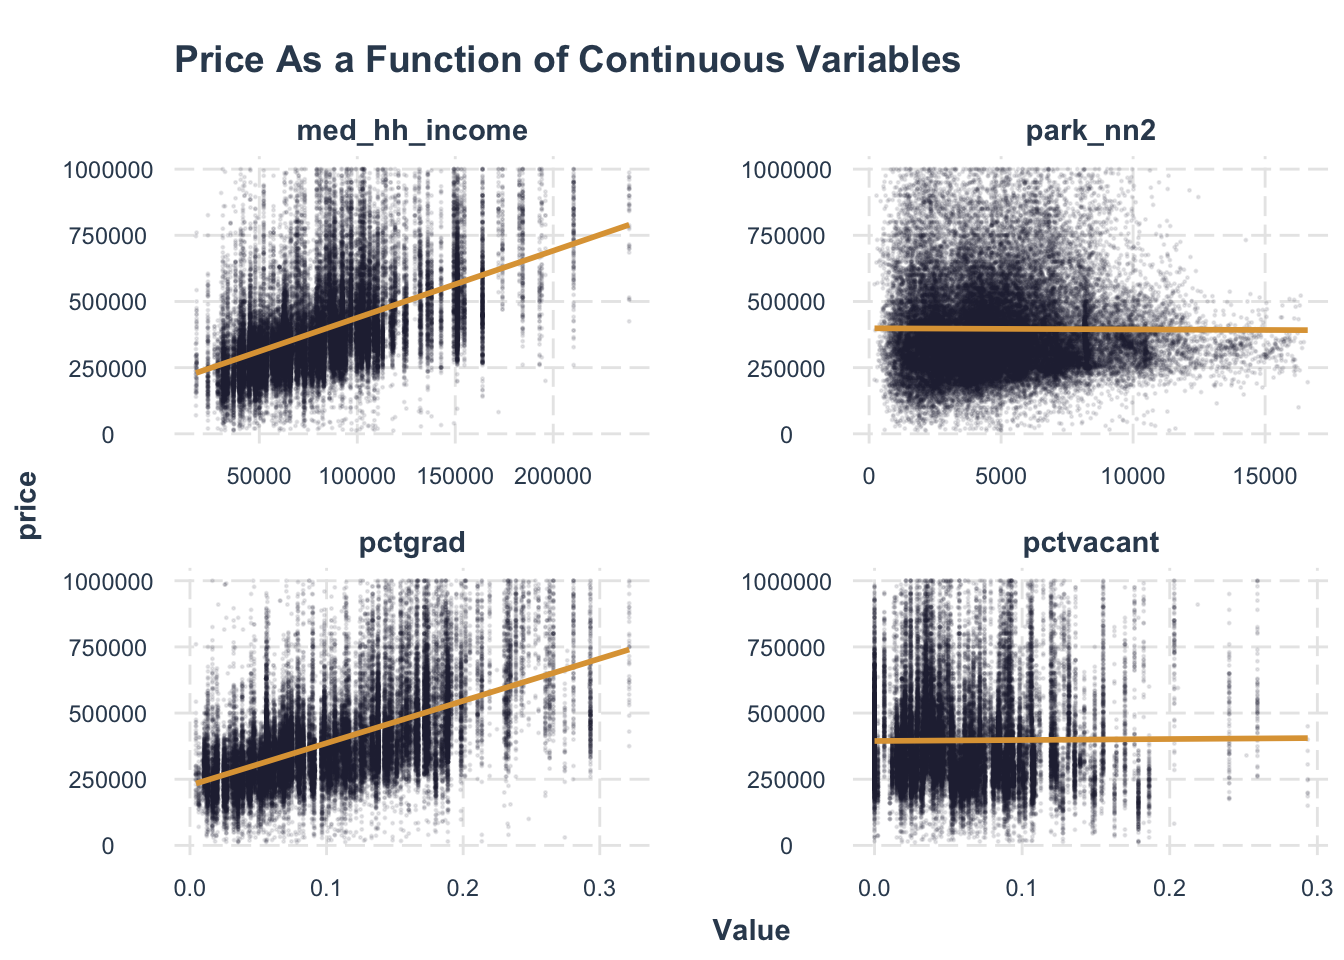
Analyzing Associations
We chose four factors that we thought were most relevant to house price, but it appears that school has little effect on home prices. But I wonder what will change in the multi-factor model afterwards.
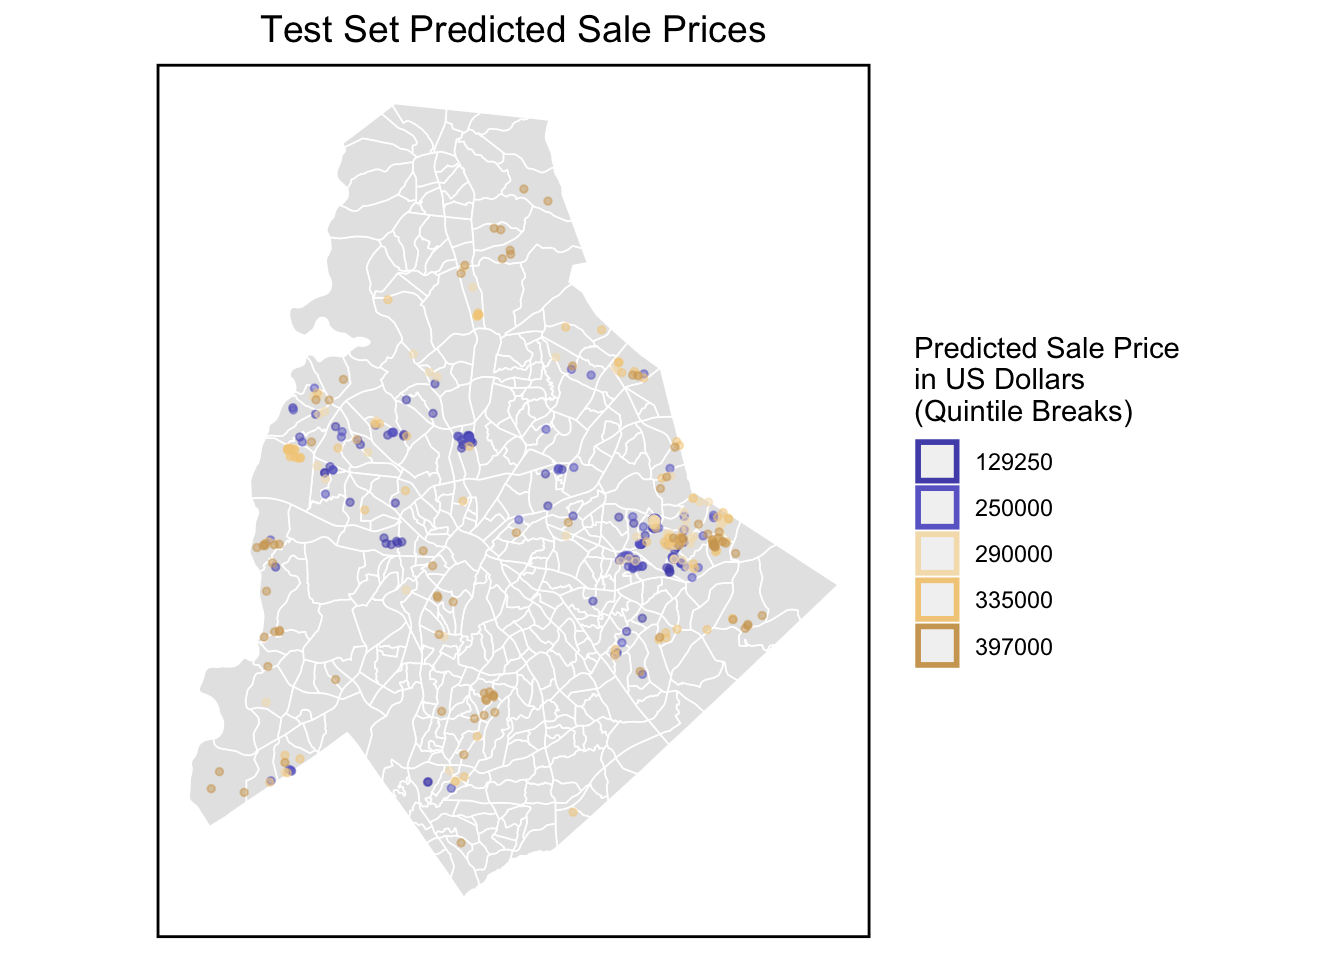
Model Comparison (OLS & Spatial Lag Models)
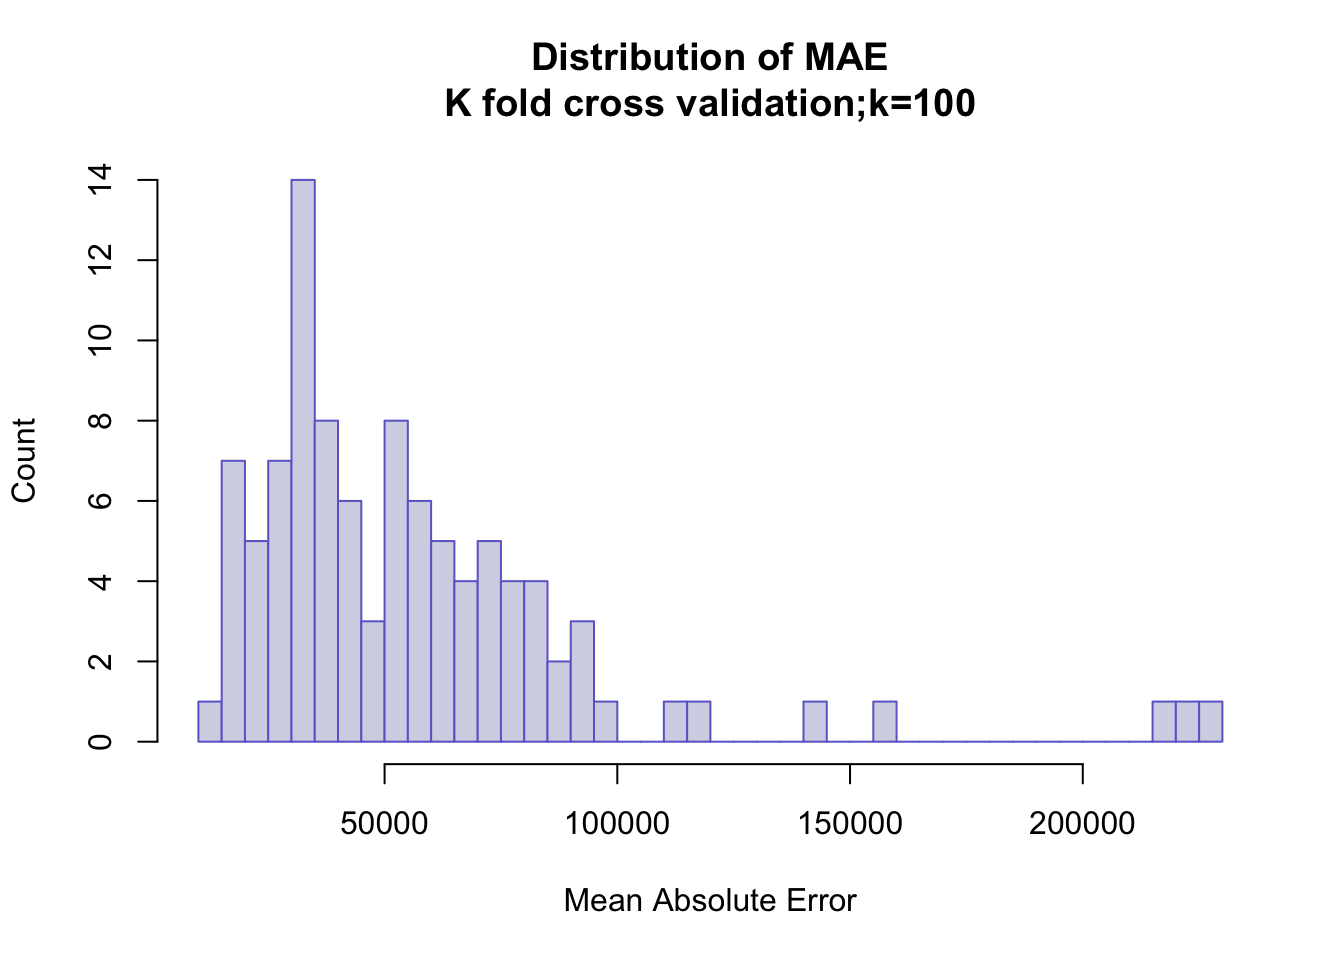
The distribution of MAE in OLS model is not aggregated enough, which there are still many scattered distributions. We consider that the reasons for this distribution may be:
1. The presence of some extreme values
2. The presence of spatial correlation.
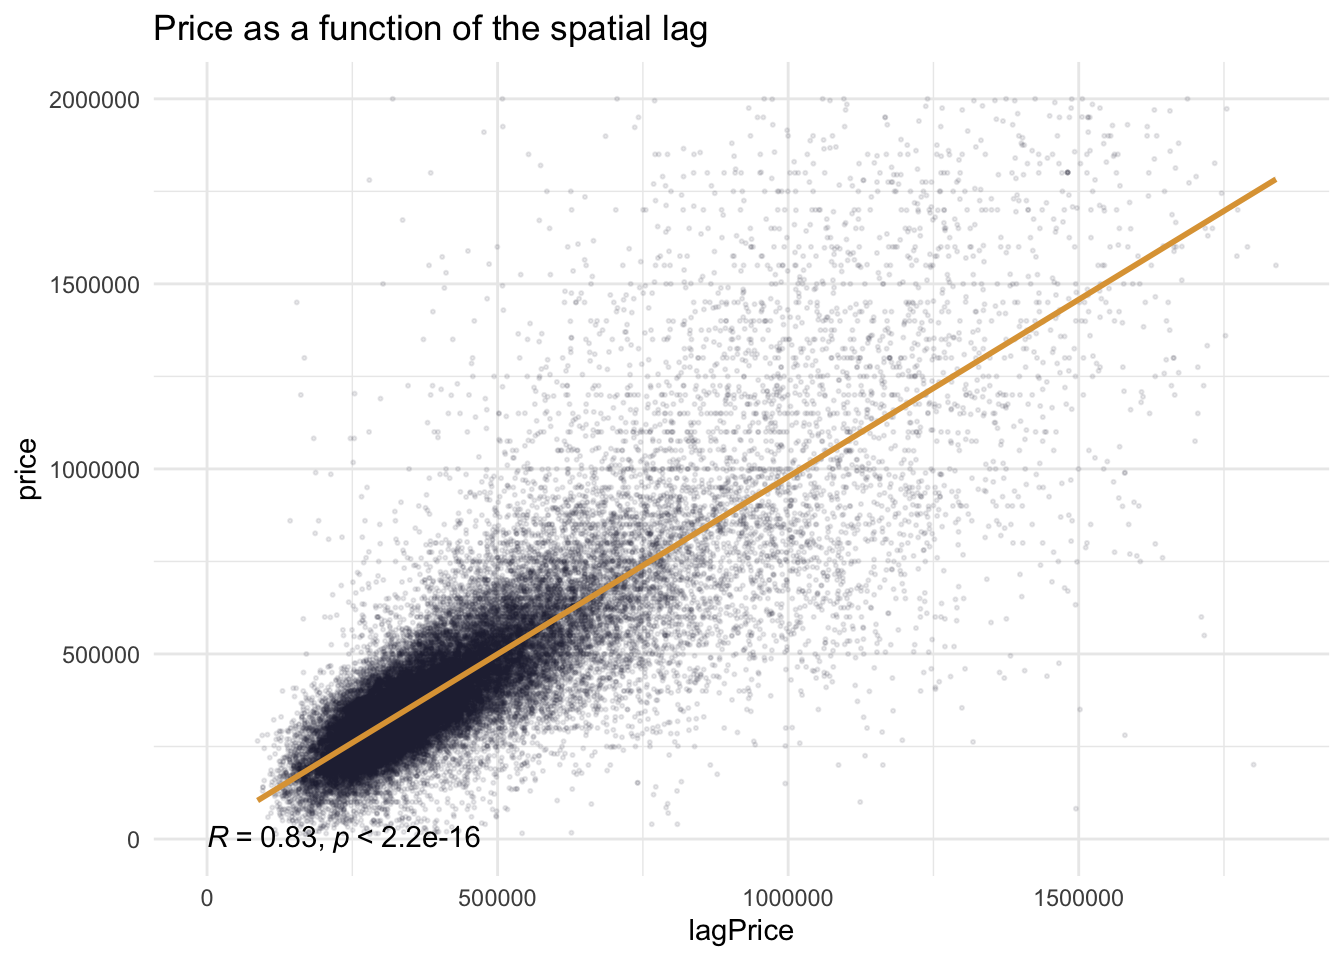
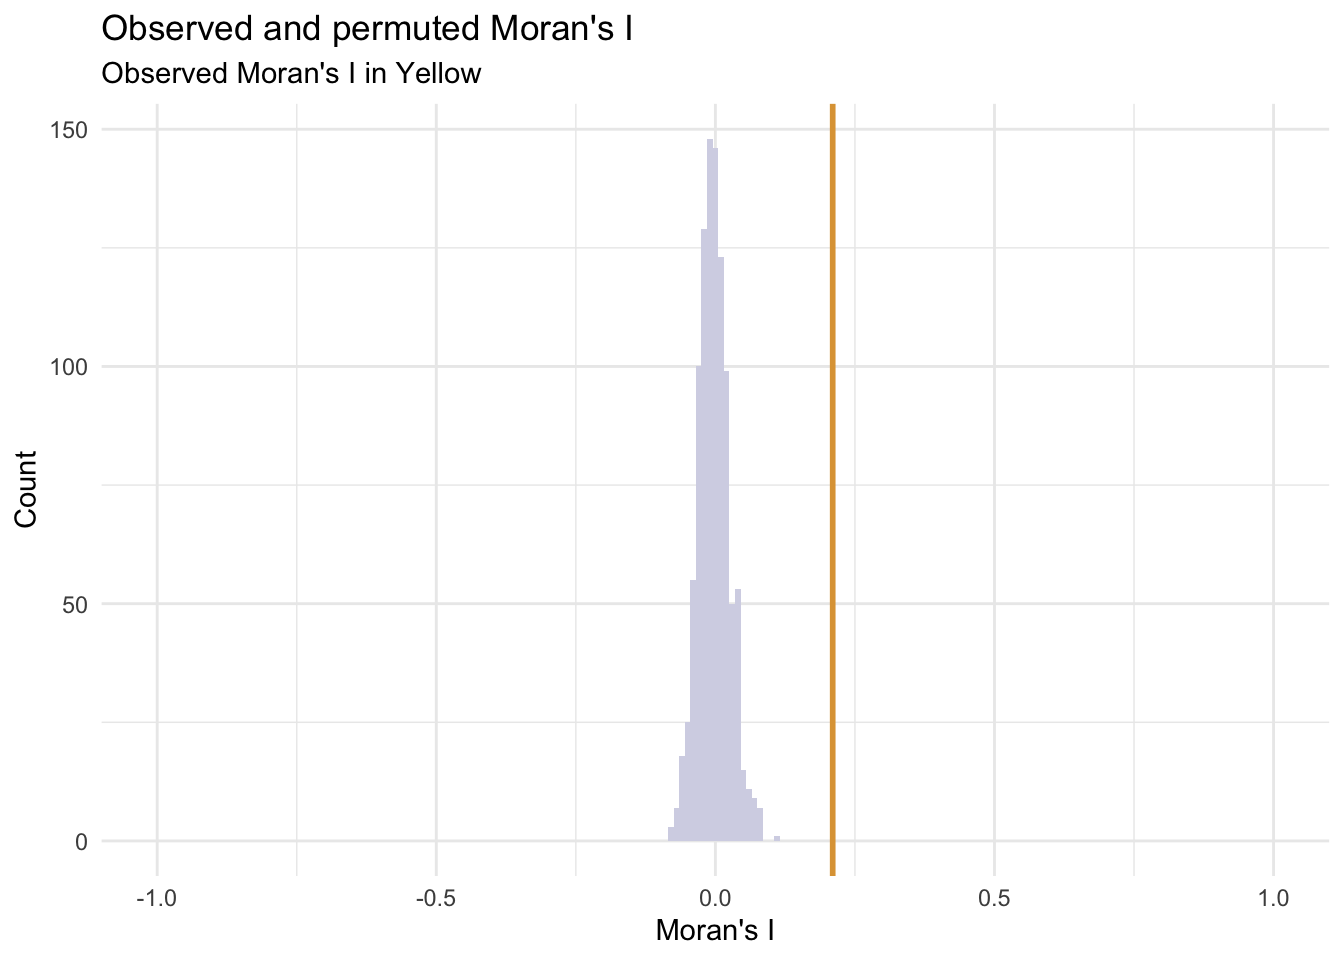
Moran’s I Test
The Moran’s I test results confirm our interpretation of the map. The Clustered point process yields a middling I of 0.31(Moran’s I value). But a p-value of 0.001 suggests that the observed point process is more clustered than all 999 random permutations (1 / 999 = 0.001) and is statistically significant.
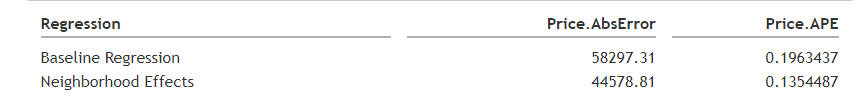
Generalizability
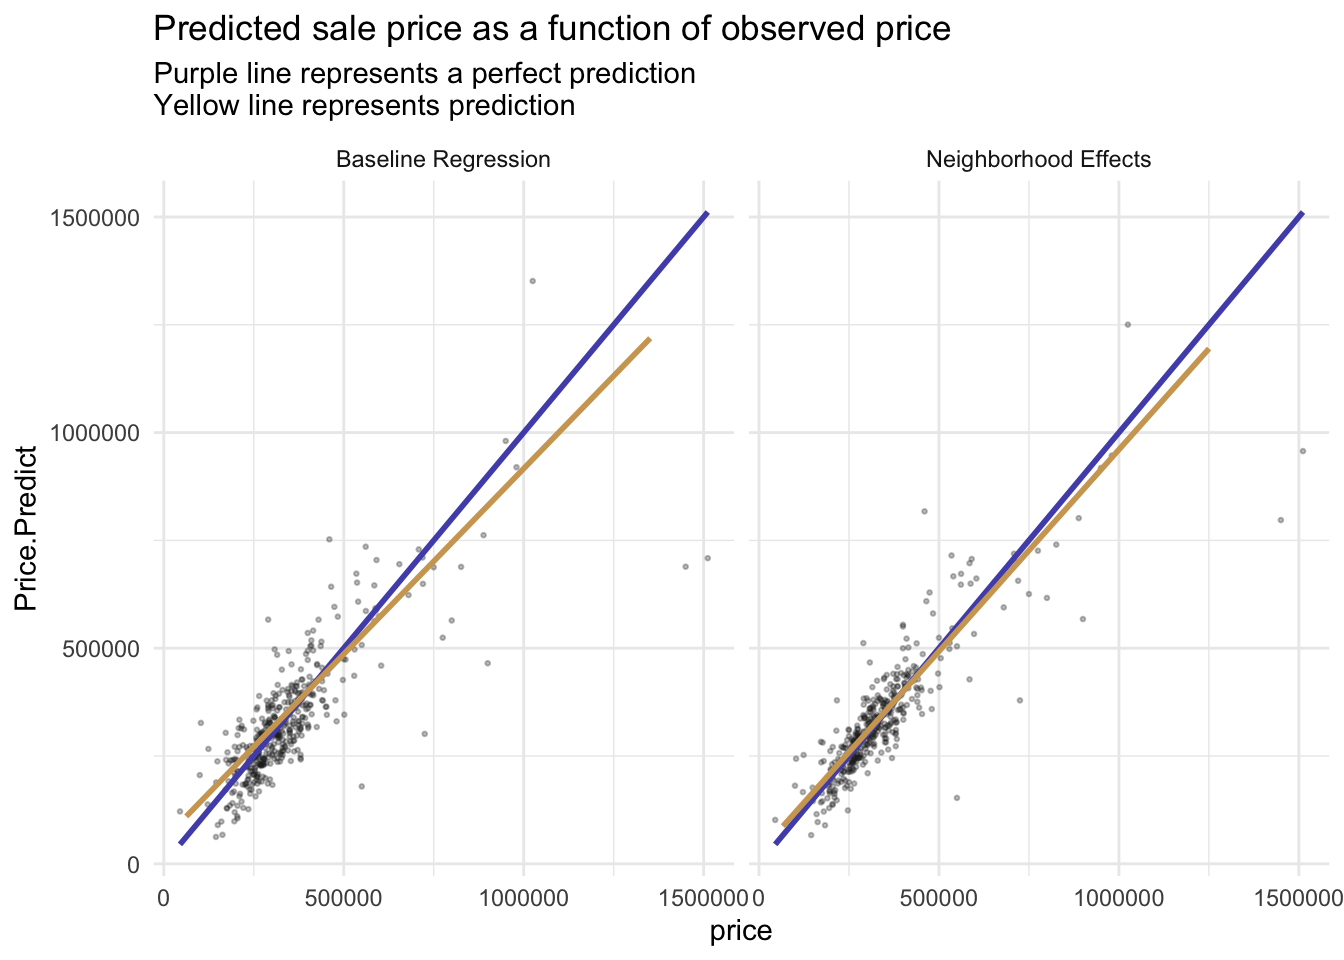
The AbsError and APE all decrease, which means the Neighborhood Effects model is more accurate on both a dollars and percentage basis.
Predicted prices are plotted as a function of observed prices. Recall the purple line represents a would-be perfect fit, while the yellow line represents the predicted fit.
We would recommend this model. first we calculated our APE in the test set to be around 0.16, which is an acceptable margin of error.
When we compare the baseline model with the neighborhood model, we find that the regression curve becomes very well fitted after adding the spatial factor. the value of r-squared also remains stable at around 0.83.
And in terms of generalizability, our model has relatively strong generalizability across different kinds of partitions. However, it is worth mentioning that our model seems to fit better for high-income communities. The reason may be due to the larger amount of data in high-income communities or the richer facilities in high-income communities.
There are still some limitations in our model. If we need to create a super model that is broadly applicable to many types of communities, firstly, we are going to find the best predictive features or variables. Secondly, we have to try to inject enough predictive power into the model to make good predictions without over-fitting.