2. Forecast Metro Train Delays in NJ

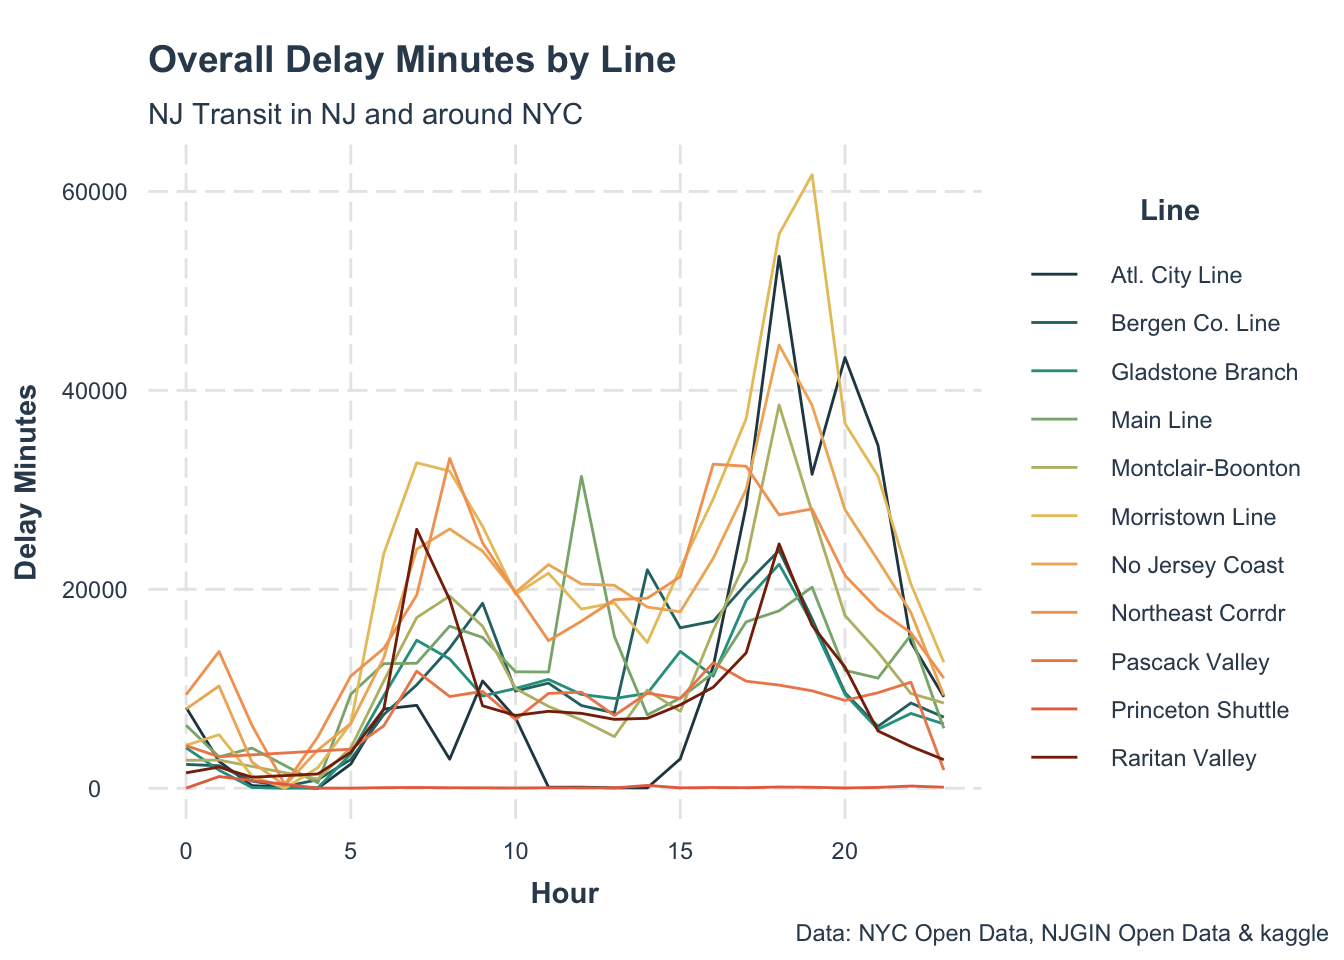
NJ Transit system is a non-cyclical rail network that owns 11 lines and services 162 train stations in New Jersey and connects travelers to New York Penn Station. The region of NJ Transit operations has complex system dynamics that affect thousands of people everyday. Train delays will affect many people’s travel and schedules. Therefore, a good prediction could allow enough time for passengers to consider train delays and anticipate in advance.
Delay is the extra time it takes a train to operate on a route due to many factors, such as weather, stations, lines, and equipment. The delay will not only affect the operation of the train but also spread in the section, causing other trains to be late. Train delays will also cause a long time of passenger retention and bring inconvenience. We want to study trends and offer a better understanding of the principal factors that contribute to training delays. Therefore, our goal is to provide a reliable prediction of station delay that can help dispatchers to estimate the train operation status and make reasonable dispatching decisions to improve the operation and service quality of rail transit.
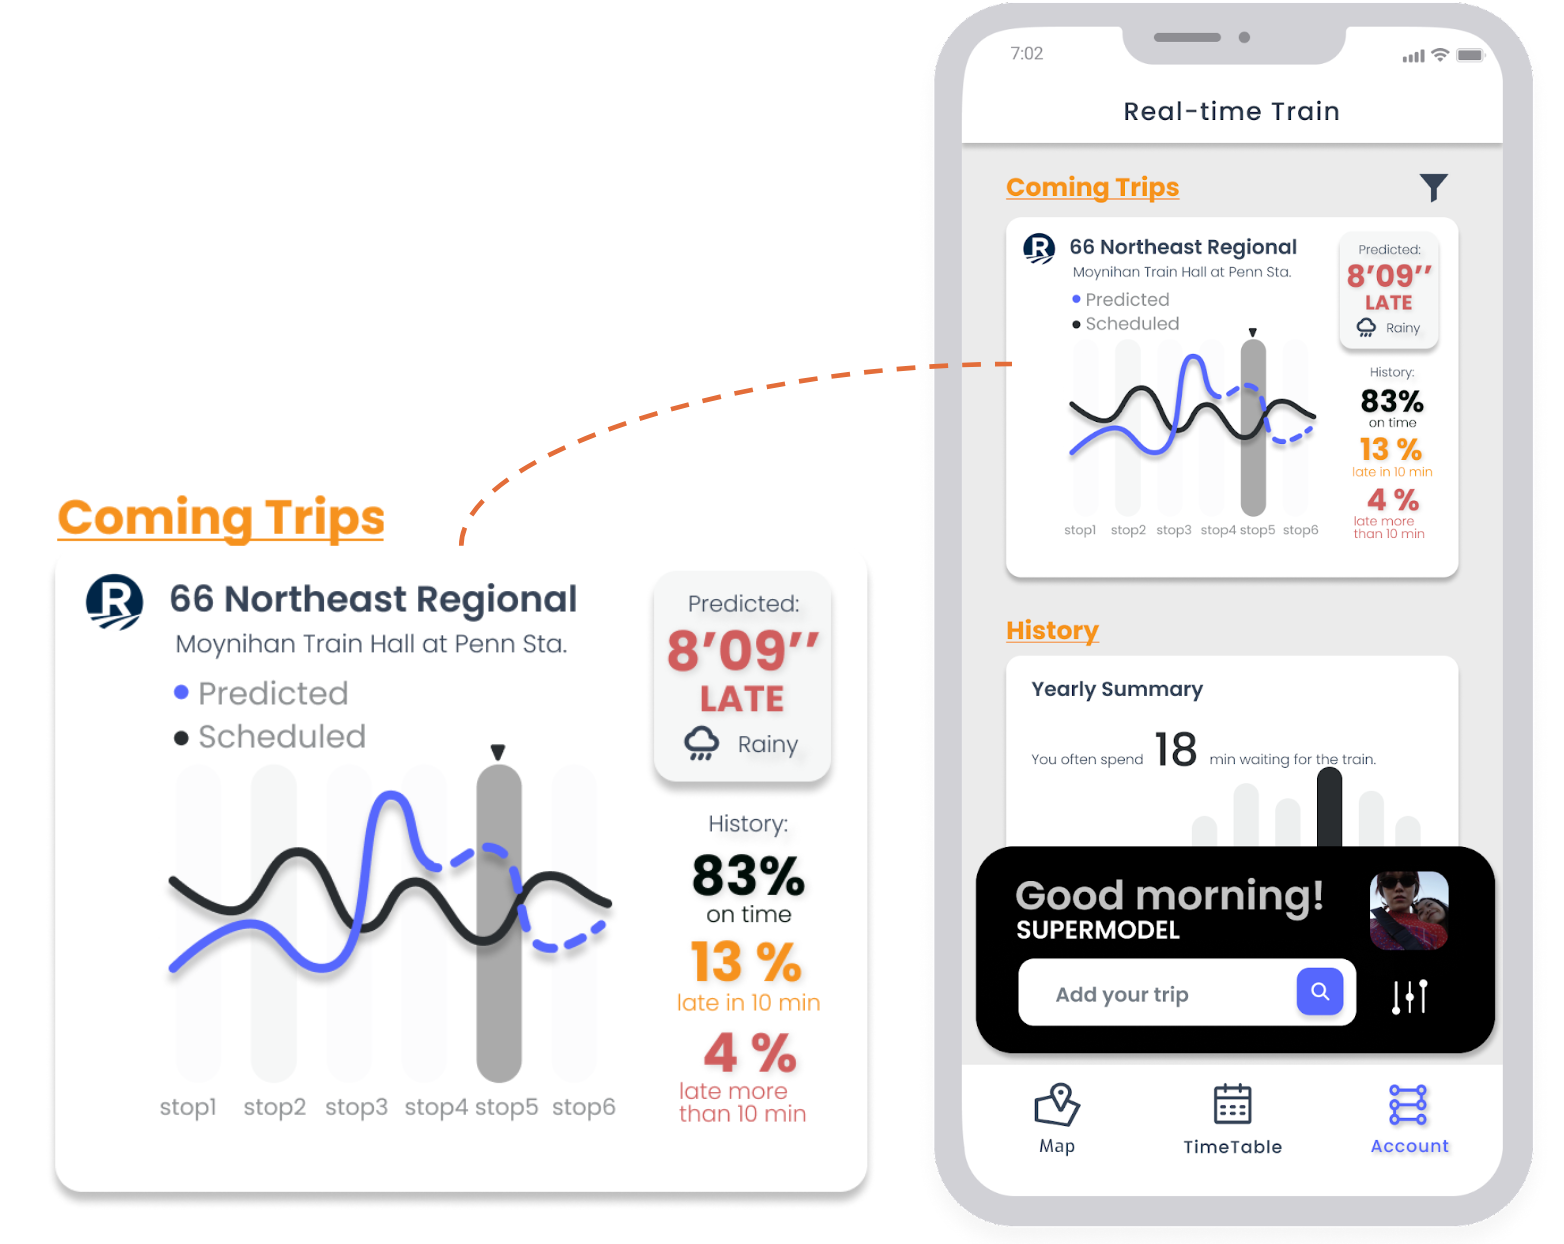
UI Design
According to this use case, we will focus on Rail Passengers. We design three main functions for them, which is to get real-time train information, offer train delay prediction. And users can click the customize button to get the train report by adding the train they interested.


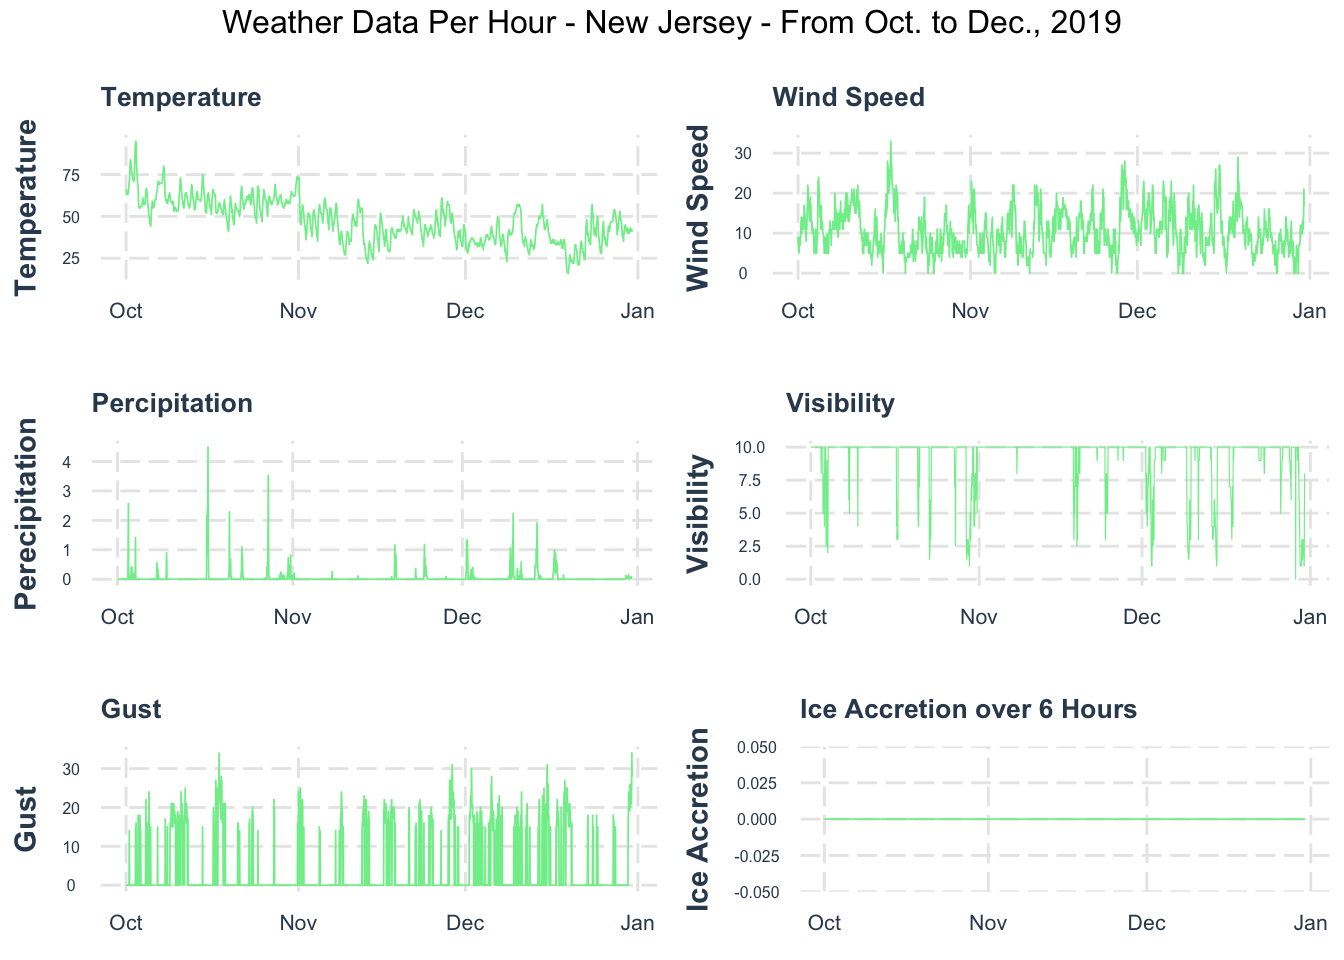
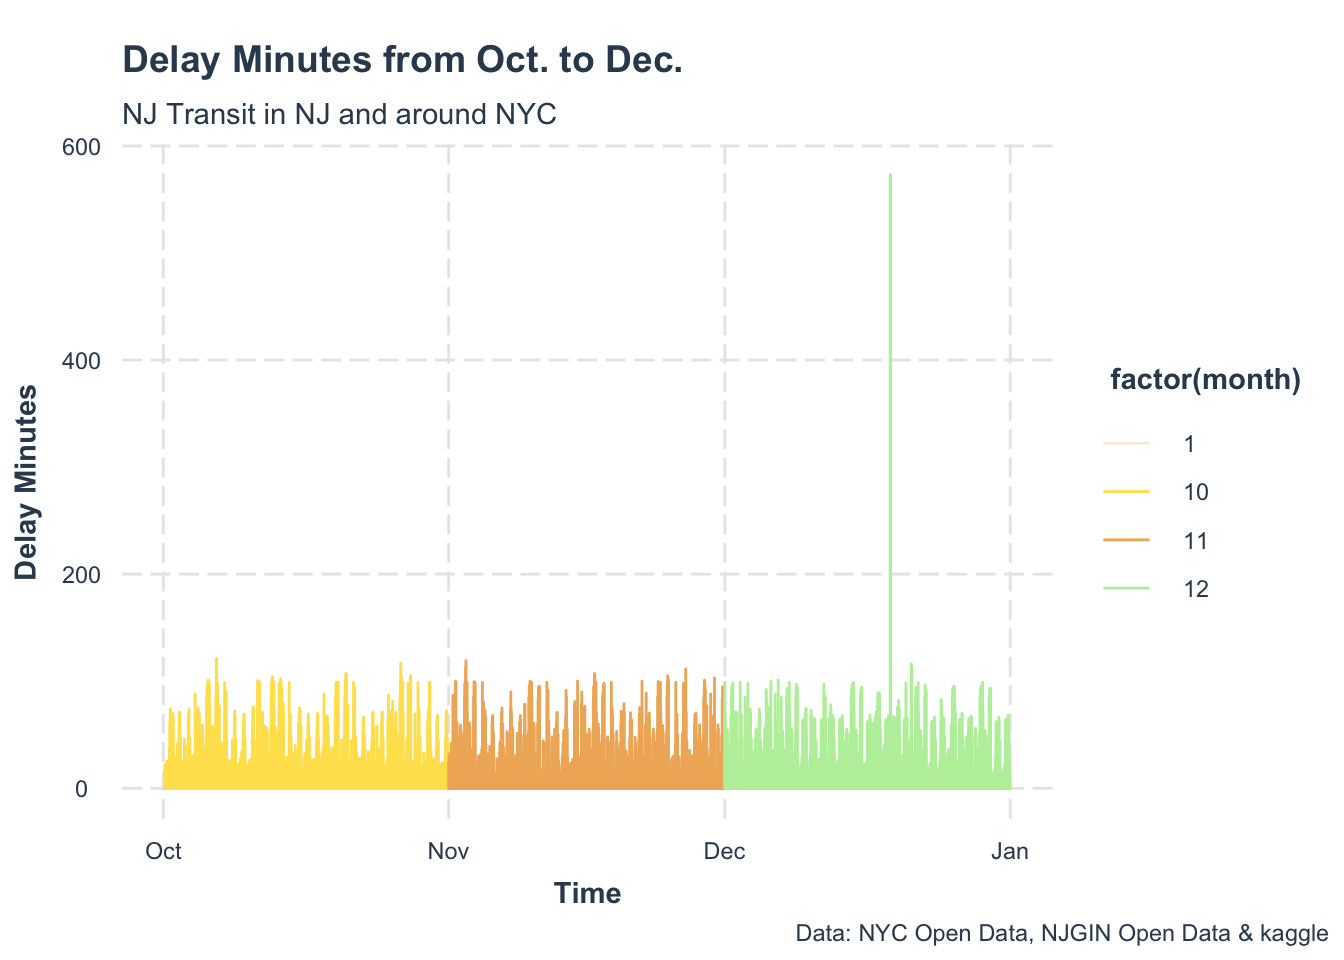
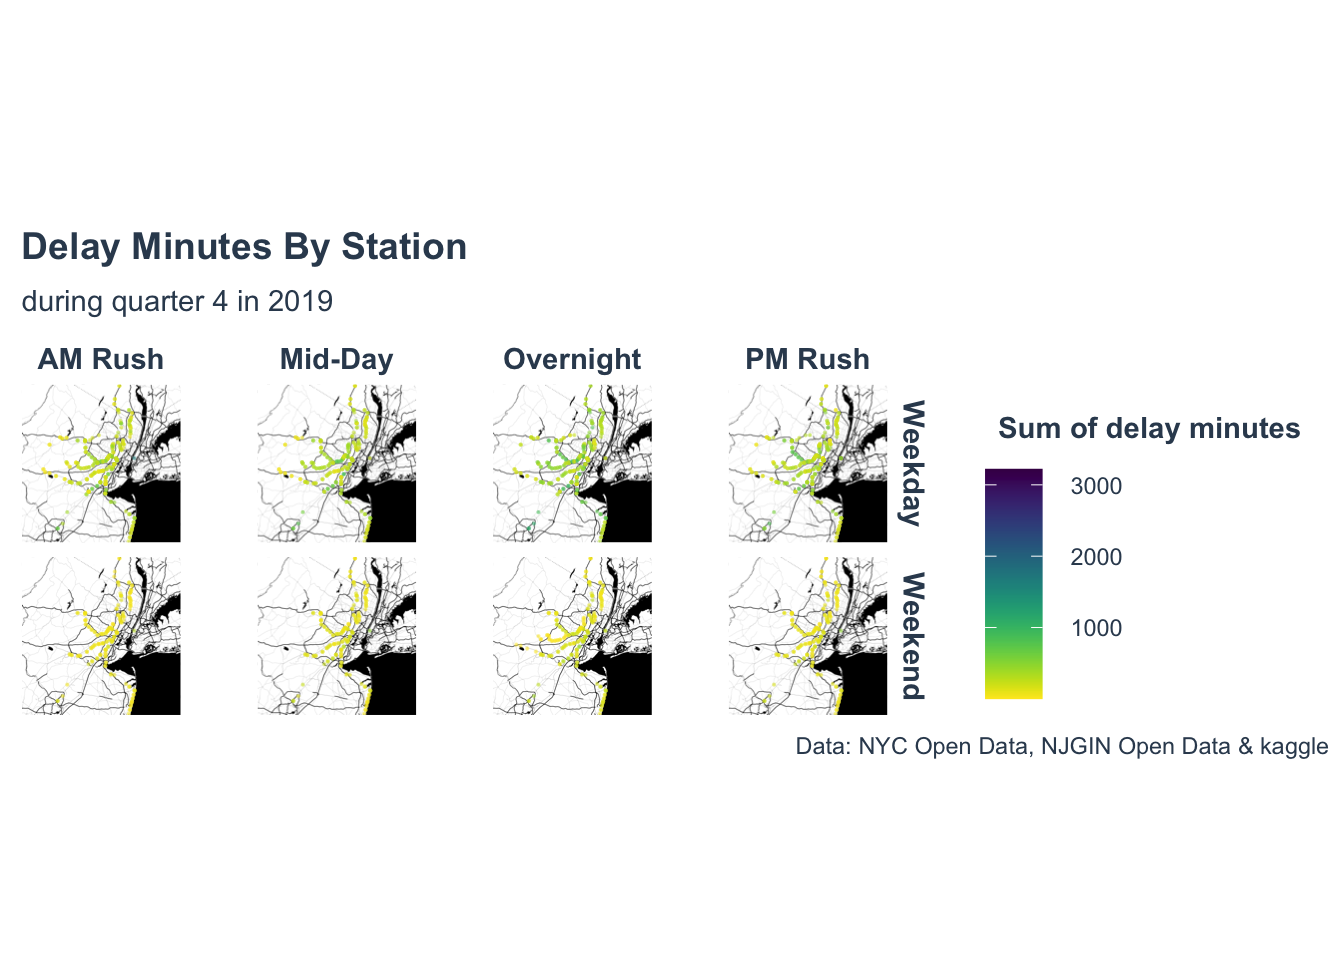
Data Exploratory


Model
I created 7 regression models to identify the effects of spatial factors, temporal factors and also external features.
- Model A focuses on just time effects, including temporal controls: hour fixed effects, day of the week.
- Model B focuses on just space effects with the stations fixed effects, and also includes day of the week and the weather.
- Model C includes both time and space fixed effects, and also contains weather.
- Model D focuses on station lags, with both time and space fixed effects, weather and transportation features.
- Model E focuses on time lags, with both time and space fixed effects, weather, and transportation features.
- Model F focuses on both time lags and station lags, also includes time and space fixed effects, then contains weather and transportation features.
- Model G includes both time and space fixed effects, and also both time lags and station lags, then contains weather, transportation features and census factors.
Mathematically, we use some common evaluation metrics to examine the performance of models.
- Mean Absolute Error (MAE): the mean absolute error between observed and predicted values.
- R-squared (R2): the higher the R-squared, the better the model.
- Residual Standard Error (RSE): the lower the RSE, the better the model.
- AIC: the lower the AIC, the better the model.
From the summary table, the Model E, F, G have lower AIC value, and R-squared are much higher, compared with Model A, B, C, D. We conclude that adding station lags significantly improves the performance of model.
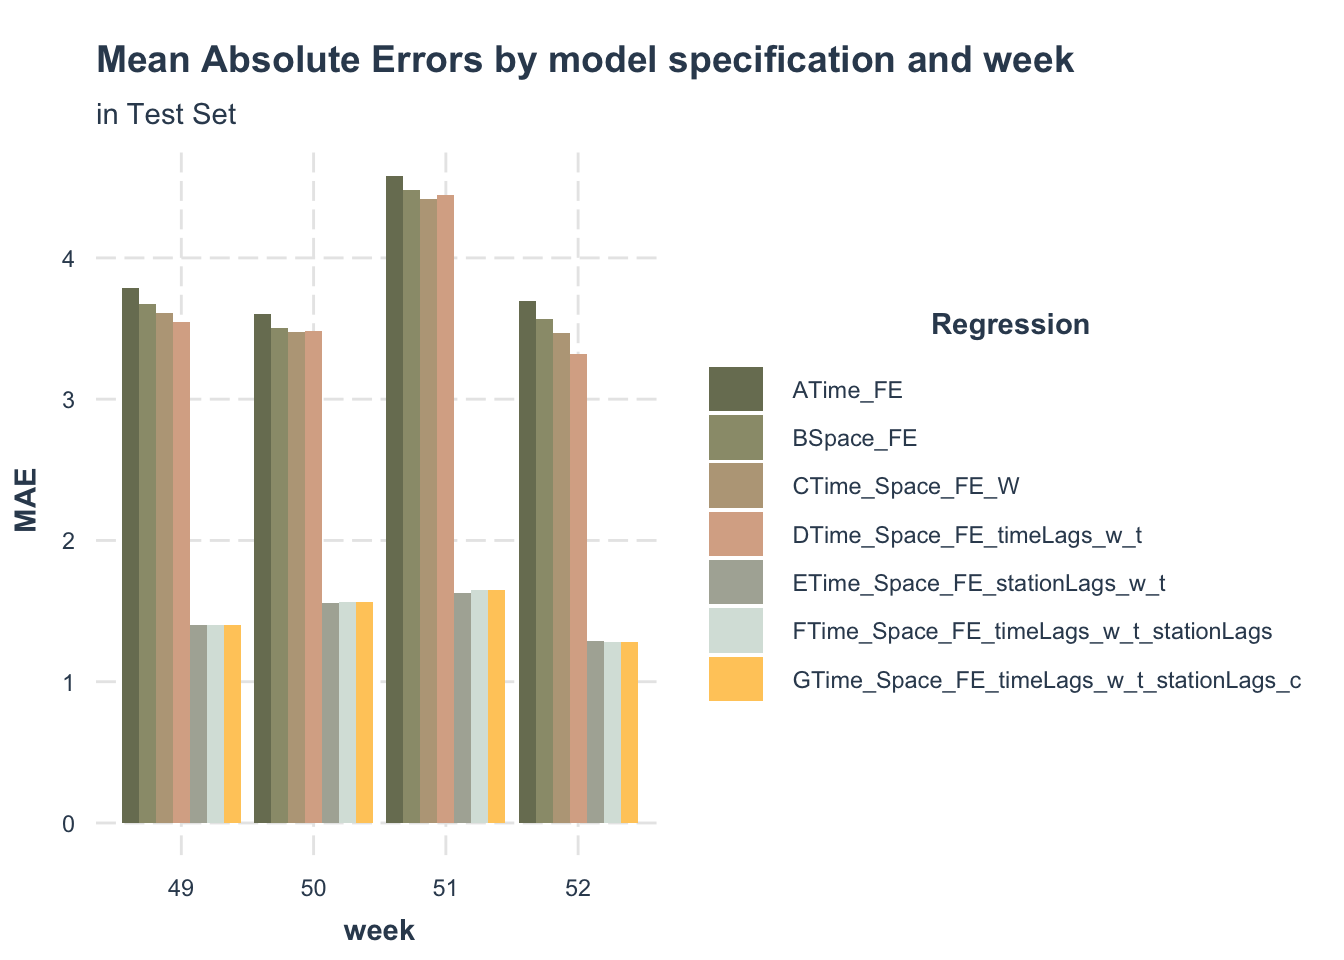

Main Abs Error in Test Set