5. Targeting A House Subsidy
To decrease the severe situation in housing and economic problem, HCD wants to improve householders’ conditions by offering a home repair tax credit. Data analytics is helpful in this process. As we all know, the low conversion rate of promotion, offer, and allocation credits will lead to low effectiveness of HCD. The department will pay more because they can not reach out the eligible homeowners. I think data science can be helpful in this condition, especially the logic model, which can categorize people’s willingness to take credit.
Data Exploratory


Logistic Model Evaluation
Compared two models, previous one’s (before feature engineering) distributions are more concentrated on the average values. So the model before feature engineering performs better in the Cross Validation.
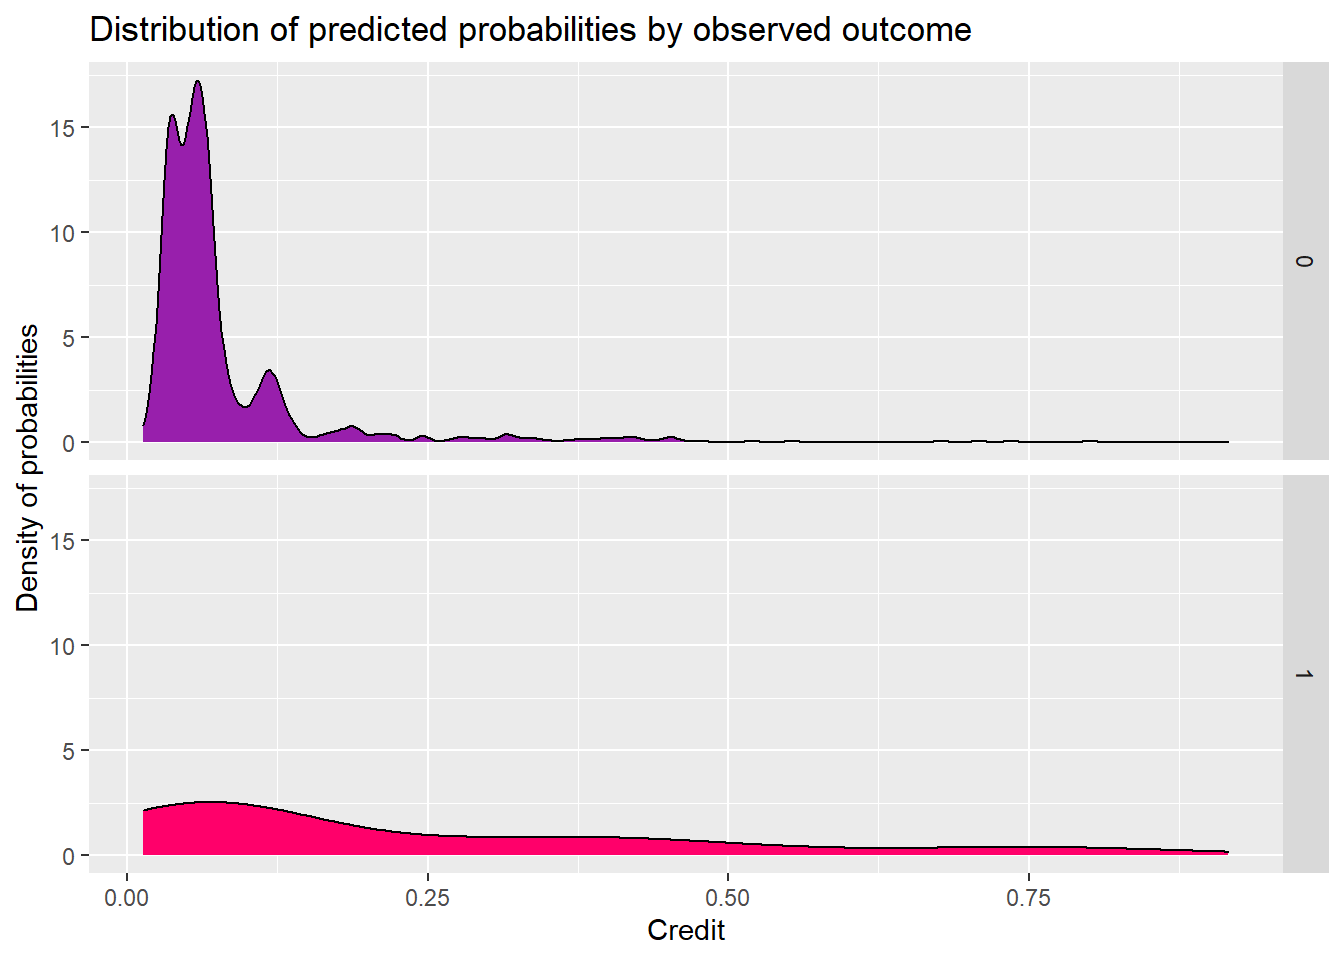
The model performs well in people who don’t get the credit. But the people who will get the credit curve is flatten and has a small peak in the low threshold.

ROC Curve

Cost Benefit Analysis
This has all been building to an examination of the model in the context of our ad campaign. Let’s set this up to estimate the revenues associated with using this model under the following scenario:
-An impression (serving an ad) costs $0.10
-A click brings an estimated $0.35 of revenue per visitor on average.
a. Cost/Benefit Equation for Confusion Metric
True Positive - Predicted correctly homeowner would enter credit program; allocated the marketing resources, and 25% ultimately achieved the credit. True Negative - Predicted correctly homeowner would not take the credit, no marketing resources were allocated, and no credit was allocated. False Positive - Predicted incorrectly homeowner would take the credit; allocated marketing resources; no credit allocated. False Negative - We predicted that a homeowner would not take the credit but they did. These are likely homeowners who signed up for reasons unrelated to the marketing campaign. Thus, we ‘0 out’ this category, assuming the cost/benefit of this is $0.

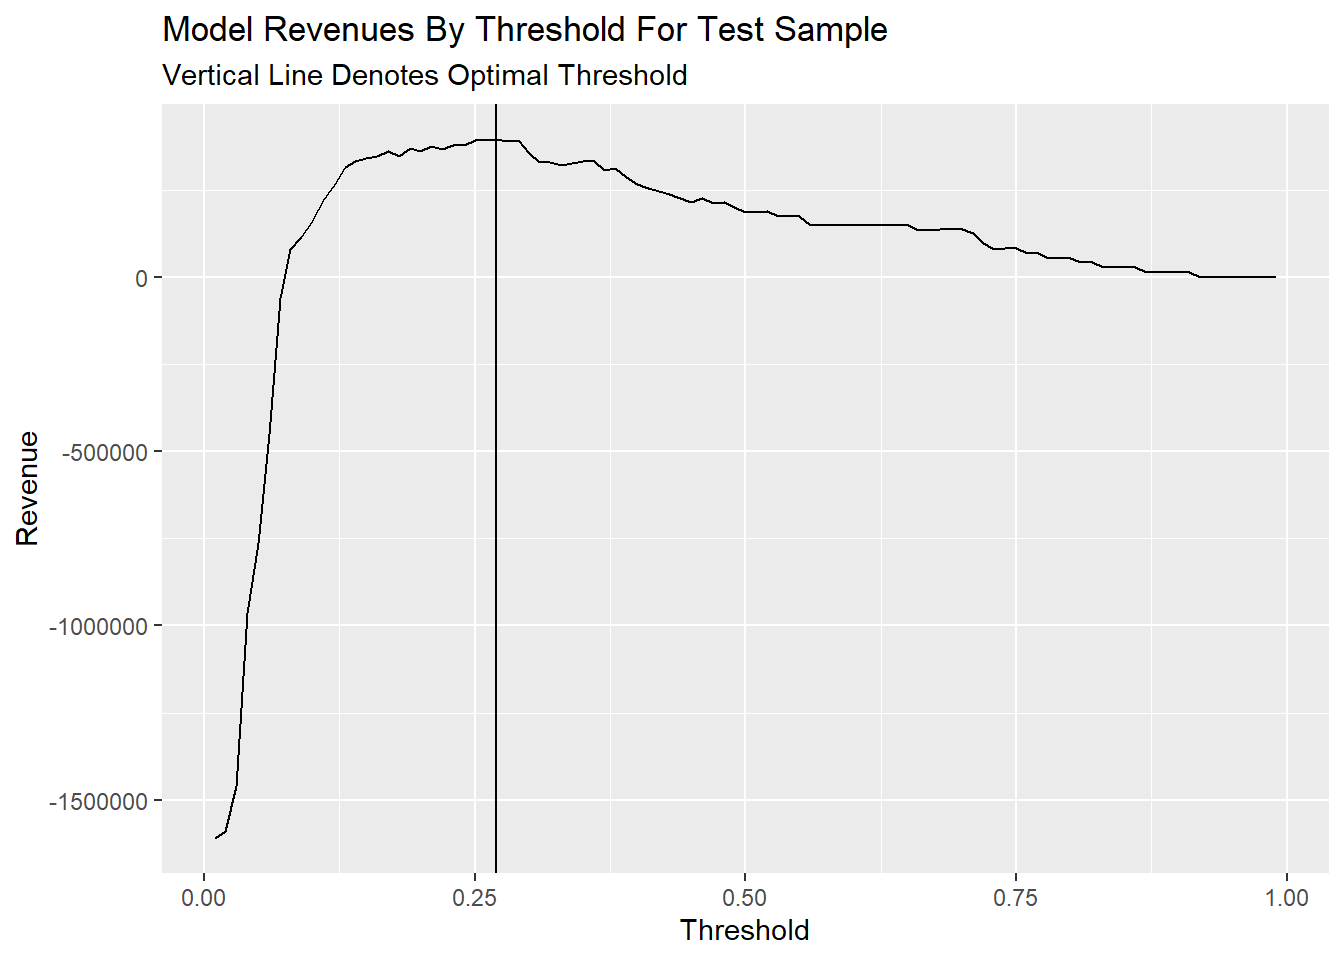
b. Plot Confusion Metric Outcomes of Each Threshold
Threshold as a function of Total_Revenue elaborates that total avenue all converge on 0 when the threshold gets bigger. According to my calculate function of revenue, True_Negative and False_Negative make 0 effects on revenue, so they are stable whether how the threshold change. As for True_Positive, when the threshold gets bigger to 1, the count of True_Positive will decrease close to 0, so the revenue will close to 0. The same as False_Positive.
This plot can be concluded the total count of negative samples is much bigger than positive samples, which may affect the accuracy difference between negative and positive samples. And both negative and positive results will change a lot in the range of 0.05-0.2 threshold.